A measurement-first proposal for Wave · timed to the business-Trends rollout
The business-side Trends rollout, the cash advance, and what we can learn together
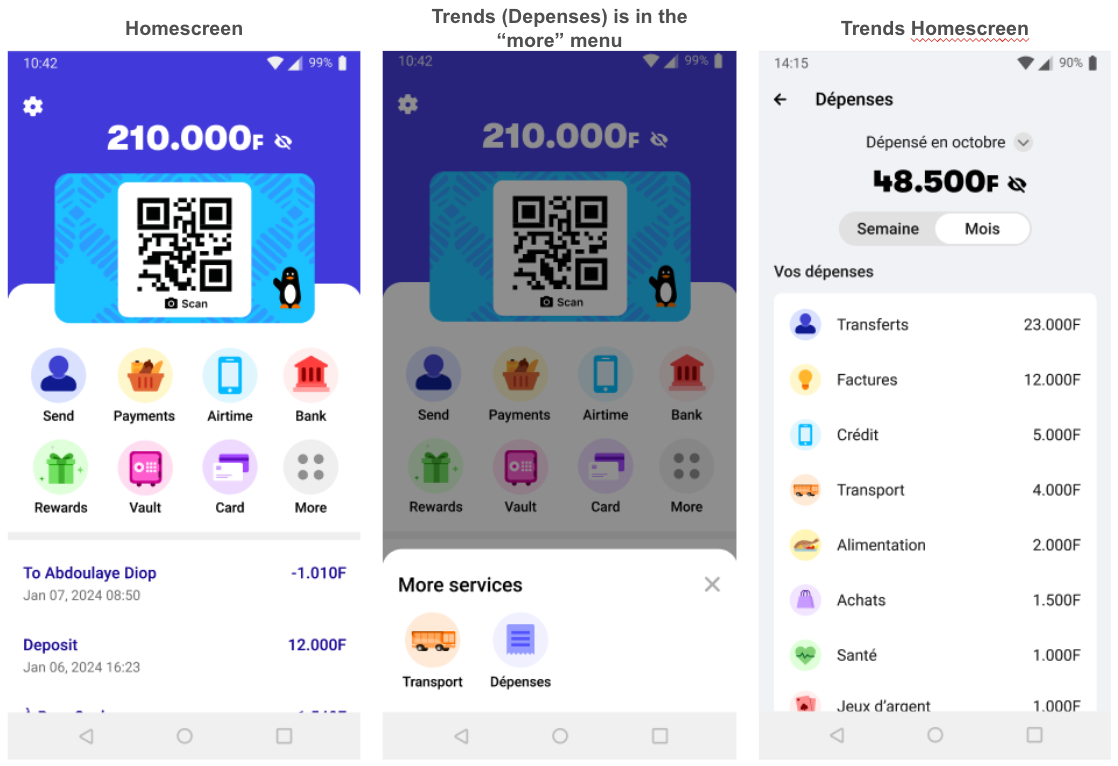
Wave is rolling out business-side Trends ("Chiffres") in Senegal and Côte d'Ivoire — the merchant analog of the consumer-side Trends already used by ~2.2M Wave customers. We're proposing a short randomized experiment timed to that rollout, paired with a brief phone or in-app forecast module that elicits merchant beliefs about both revenue and fees. The trial is fast, low-risk, and gives Wave evidence-based answers to two design questions it's already considering — what categories to surface in Chiffres, and whether and how to display fees — while producing the inputs needed to redesign the cash-advance product in the Gambia (and eventually CI / SN) on a different sample.
The proposal in one paragraph ¶
─── two coordinated experiments · one drives the other
We propose two coordinated experiments. The first is timed to the business-Trends rollout in SN and CI: we randomize merchants across engagement nudges (push notifications, login-tied incentive) × content variation (default Chiffres view vs. a category-broken-down + personalized rules-of-thumb view derived from each merchant's own transaction history), plus a pure no-contact control. Cross-randomized within the rollout: a fee-display sub-arm — directly testing Colin's hypothesis that small merchants over-estimate the fees they're paying. We pair the rollout with a short phone or in-app belief-elicitation module that asks merchants to forecast next-month revenue, a category of expenses, and the fees they expect to pay, all verifiable against Wave records. The second experiment is a follow-on test of the cash-advance product (currently in The Gambia, expanding to SN / CI) — varying loan size, deduction rate, repayment cadence, or fee-disclosure — designed in light of what the Trends experiment reveals about merchant calibration. The Trends experiment produces a design read in 1–3 months; the cash-advance follow-on can run in parallel on a separate sample or sequentially.
We don't have to wait for a publishable Trends paper to design a better cash advance, a better Chiffres category set, or a better fee-display policy. Even a one-month belief-elicitation pilot would tell Wave how miscalibrated merchants are about their own near-term revenue and the fees they're already paying — inputs the cash-advance product and the Trends rollout currently don't have. The fee piece is especially low-cost to add: we already have to ask merchants forecast questions; the fee question is one more module on the same call.
Why this is win-win for Wave ¶
─── engagement · fee-transparency · mission
App engagement and merchant retention
Wave's customer-side Trends has ~2.2M active users (1.6M SN, 0.6M CI) — still only ~5–15% of the active user base on each market, so headroom is large. If business merchants find Chiffres similarly useful — and the closest precedent (Dalton et al. 2024, Kenyan SMEs on Safaricom's merchant payment product) finds that mobile-money tools reduce sales volatility and precautionary inventory even when they don't move revenue levels — they'll open Wave more often. More sessions mean more transactions, more cash-advance applications, and stickier merchants. eBay's randomized Seller Hub rollout (Bar-Gill et al. 2024) saw +3.6% in weekly sales among small sellers; roughly a third of that effect was driven by active monitoring of the dashboard, which is exactly the layer Wave can experimentally turn on with push notifications.
images/wave_customer_trends.png
Fee transparency as a retention lever
Wave charges 1% on every merchant-accepted payment, but the first 20,000 F of daily payment volume is exempted — so most small merchants pay very little in fees. The behavioral question Colin has flagged is that merchants likely over-estimate what they pay. If that's right, surfacing accurate fees in Chiffres should reduce the friction that today causes some merchants to accept Wave reluctantly, raising volume routed through Wave's rails. The Trends RCT can causally test this with a fee-display sub-arm cross-randomized inside the 2×2 (§04), and the belief-elicitation module measures the gap between perceived and actual fees directly (§03). This is the most directly Wave-actionable outcome of the trial.
Mission alignment with measurable welfare outcomes
Sales volatility, precautionary inventory, forecast calibration, and accurate beliefs about fees are the margins where mobile-money tools have measurably moved merchant welfare. These are credible "improving entrepreneurs' lives" outcomes Wave can report to regulators, impact investors, and the press. Augenblick et al. (2025) finds that category-cued retrieval — the mechanism Chiffres' category breakdown plausibly delivers — raised household savings 15–20% and crop revenue 8.9% a year later in a Zambian rural sample. Even a fraction of that magnitude in Wave's setting would be a publishable, mission-aligned result.
What we're pitching in terms of measurement ¶
─── revenue forecasts · expense board · fee beliefs · in-app outcomes
Wave already has the best half of the measurement: every transaction flows through Wave's rails, so revenue, fees paid, cash-advance utilization, repayment, and engagement are server-side and ground-truthed. What's missing is the belief side — how merchants expect their own next-month revenue, expenses, and fees to look. We fill that gap with a short phone or in-app module covering three elicitations.
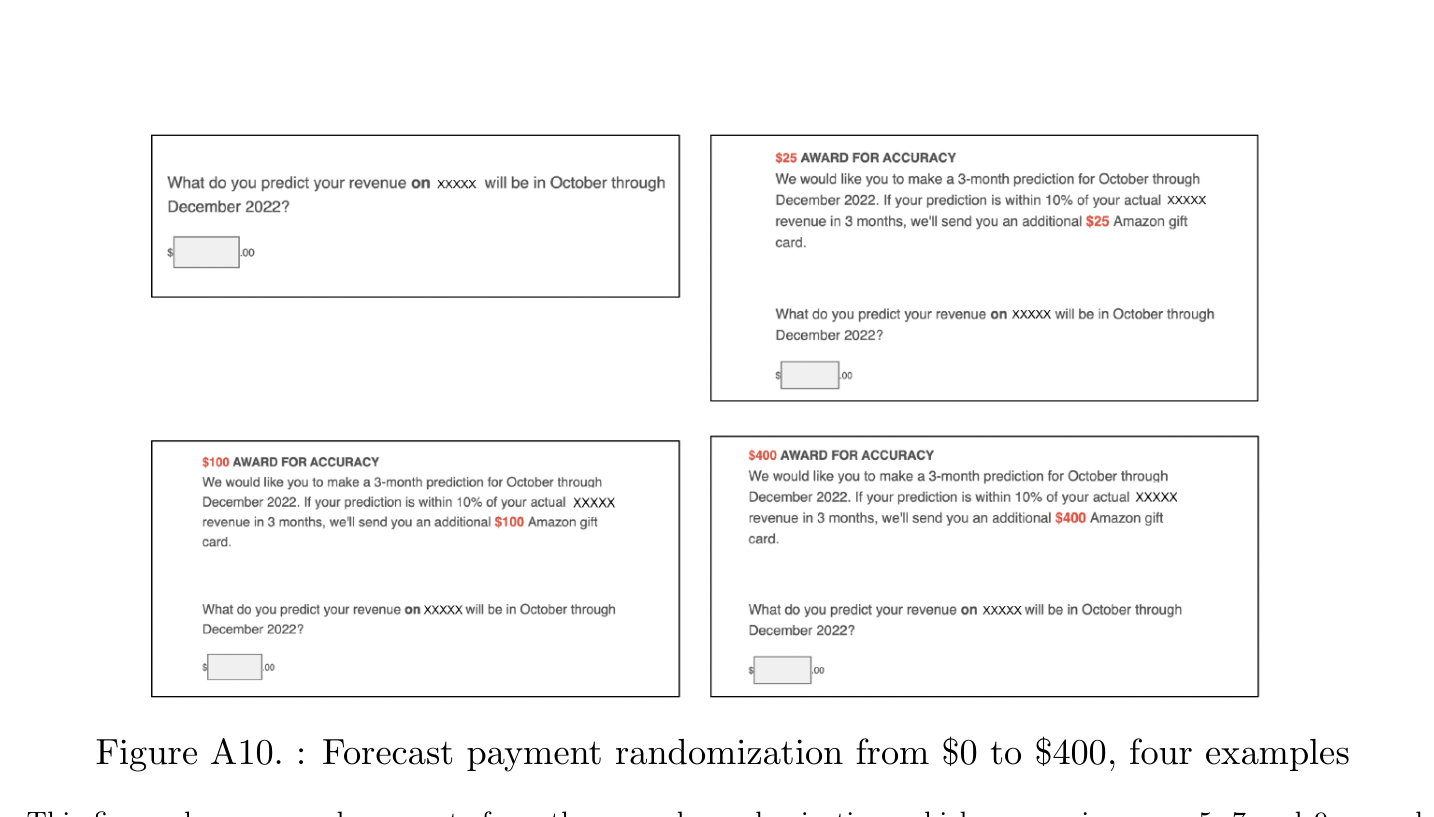
A Bloom-style revenue forecast, asked of treatment and control merchants
Bloom, Codreanu & Fletcher (2025) elicit incentivized 3-month sales forecasts on a payment-processor platform with the question "What do you predict your revenue on [platform] will be in [month] through [month] [year]?" paired with an accuracy bonus ("If your prediction is within 10% of your actual revenue in 3 months, we'll send you an additional [reward]"). We adopt this wholesale, calibrated to local incomes in CFA, and verify against the merchant's actual Wave activity in the window. Headline expectation: Bloom finds only 18% of US firms land within ±10% of actuals, mean over-optimism of +16% — for SSA mobile-money merchants we expect at least as much.
images/bloom_forecast_survey.png
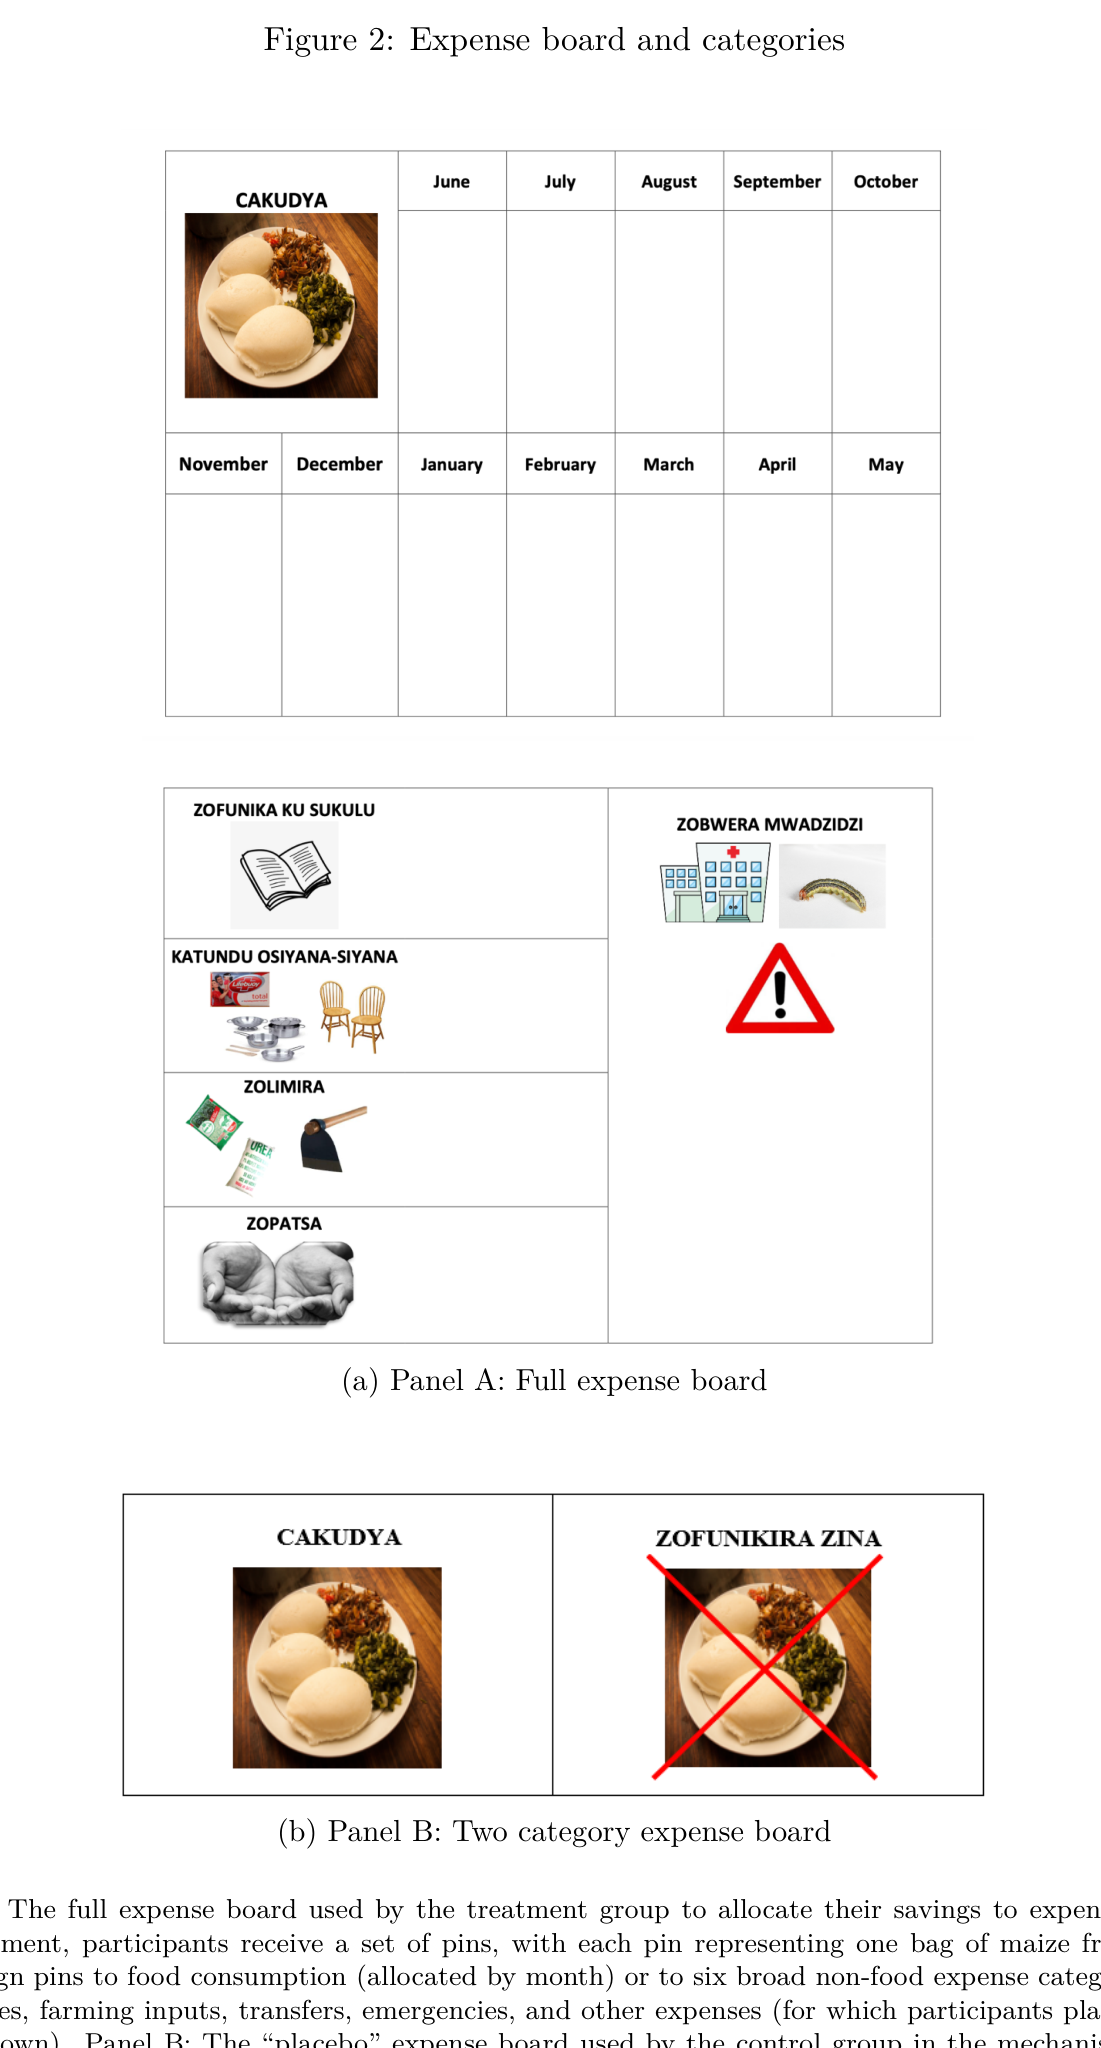
An Augenblick-style expense board, because expenses are the harder forecast
Augenblick et al. (2025) shows that category-cued retrieval — allocating expenses across pre-specified categories — moves beliefs about non-food expenses by 42–62%, raises savings 15–20% months later, and raises crop revenue 8.9% the following year. Bloom's paper suggests that revenue forecasts respond modestly to dashboard exposure; Augenblick's suggests expense forecasts respond a lot when category structure is imposed. We elicit both. If you only had budget to elicit one, the answer is expenses.
images/augenblick_expense_board.png
A Wave-specific fee-belief elicitation — the operationalization of Colin's hypothesis
The same module asks each merchant: "In the past 30 days, how much do you think you paid in fees to Wave?" We verify against Wave's records. The current pricing — 1% on payment volume above 20,000 F/day — means most small merchants pay very little, but the prediction is that they think they pay much more. If we find a 20%+ gap between perceived and actual fees, the fee-display sub-arm in §04 has a clear hypothesis: surfacing accurate fees in Chiffres should reduce the friction that today causes some merchants to accept Wave reluctantly, and the Wave-side outcome is an increase in volume routed through Wave's rails by the previously-under-using subset.
Augenblick et al. (2025) explicitly flag in footnote 1 that expense forecasting is the harder task even in highly volatile-income settings: "This is likely to be true even in low-income settings, where income is highly volatile. For example, while a vegetable vendor's income may fluctuate day to day, the sheer array of certain and uncertain expenses will likely be larger and more volatile." Wave merchants look a lot like the vegetable vendor: many small, frequent inflows; a longer, lumpier list of certain and uncertain outflows (inventory restocks, supplier payments, family transfers, rent, Wave fees, mobile-data, school fees). We therefore expect baseline expense miscalibration to be larger than baseline revenue miscalibration, and the marginal value of a category-cued retrieval surface (an Augenblick-style "expense board" inside Chiffres) to be larger on the expense side than on the revenue side. This motivates the §04 design question below: should business Chiffres mirror the consumer-side Dépenses surface and add an outflows view?
Server-side (Wave admin data, free): Chiffres engagement (views, time-on-page, return visits, category-tab vs. summary-tab visits per Bar-Gill 2024); cash-advance take-up + repayment; transaction count and volume; actual fees paid; voluntary opt-out / category-hide usage (the gambling-transactions concern Colin flagged); continued-use indicator.
Belief module (3-minute survey, treatment and control): next-month revenue forecast with accuracy bonus; one expense-category forecast (alimentation / transport / family transfers); perceived fees paid last month; self-assessed forecast win probability (per Bloom — diagnostic of overconfidence); short stress / financial-worry module (welfare guardrail).
Endline survey (one round): whether the merchant has hidden any transaction category in Chiffres and which one (welfare / privacy guardrail flagged in the §04 note); merchant self-report on whether Chiffres changed any business decision in the past month (free-text plus closed-form on the cash-advance request margin).
The design of the Trends experiment ¶
─── 2x2 factorial + pure no-contact control + fee-display sub-arm
Merchants in the business-Trends rollout are randomly assigned to one of four cells crossing engagement (cold push vs. pre-announced push + login-tied incentive) with content (default Chiffres view — Volume + Frais — vs. category-broken-down Chiffres with personalized rules-of-thumb derived from each merchant's own transaction history), plus a pure no-contact control. A fee-display sub-arm (fees surfaced prominently vs. not) is cross-randomized inside the design.
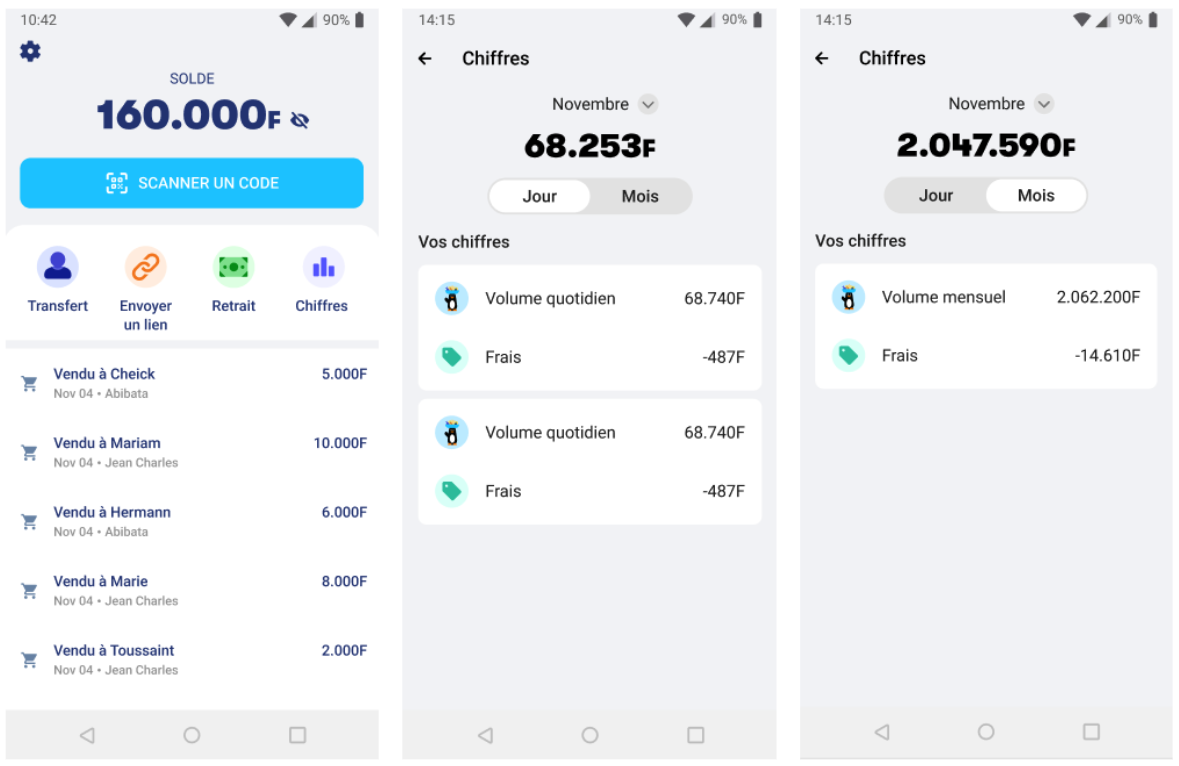
images/wave_business_chiffres.png
The consumer-side Trends ("Dépenses") surfaces outflows by category — Transferts, Factures, Crédit, Transport, Alimentation, Achats, Santé, Jeux d'argent. Business-side Chiffres today surfaces only inflows (Volume) and fees. Could the business-side rollout add a parallel outflows / expenses surface, mirroring what already works on the consumer side? Concretely: trends on inflows (revenue by category) and trends on outflows (business and personal expense categories, computed from the merchant's own payment activity).
The reason this matters experimentally is the Augenblick footnote referenced in §03: expense forecasting is the harder cognitive task even in volatile-revenue settings like Wave's. If Chiffres only surfaces inflows, the most behaviorally-loaded margin is missing. If Chiffres also surfaces outflows by category, the content arm becomes a much closer analog to Augenblick's expense board — and our prior for the effect is meaningfully larger. Operationally this is also where Wave's competitive advantage sits: most merchants in SN / CI don't have any tool that surfaces a structured picture of where their money goes.
Default Chiffres
Category + rules of thumb
Cold push
Pre-announced push + login incentive
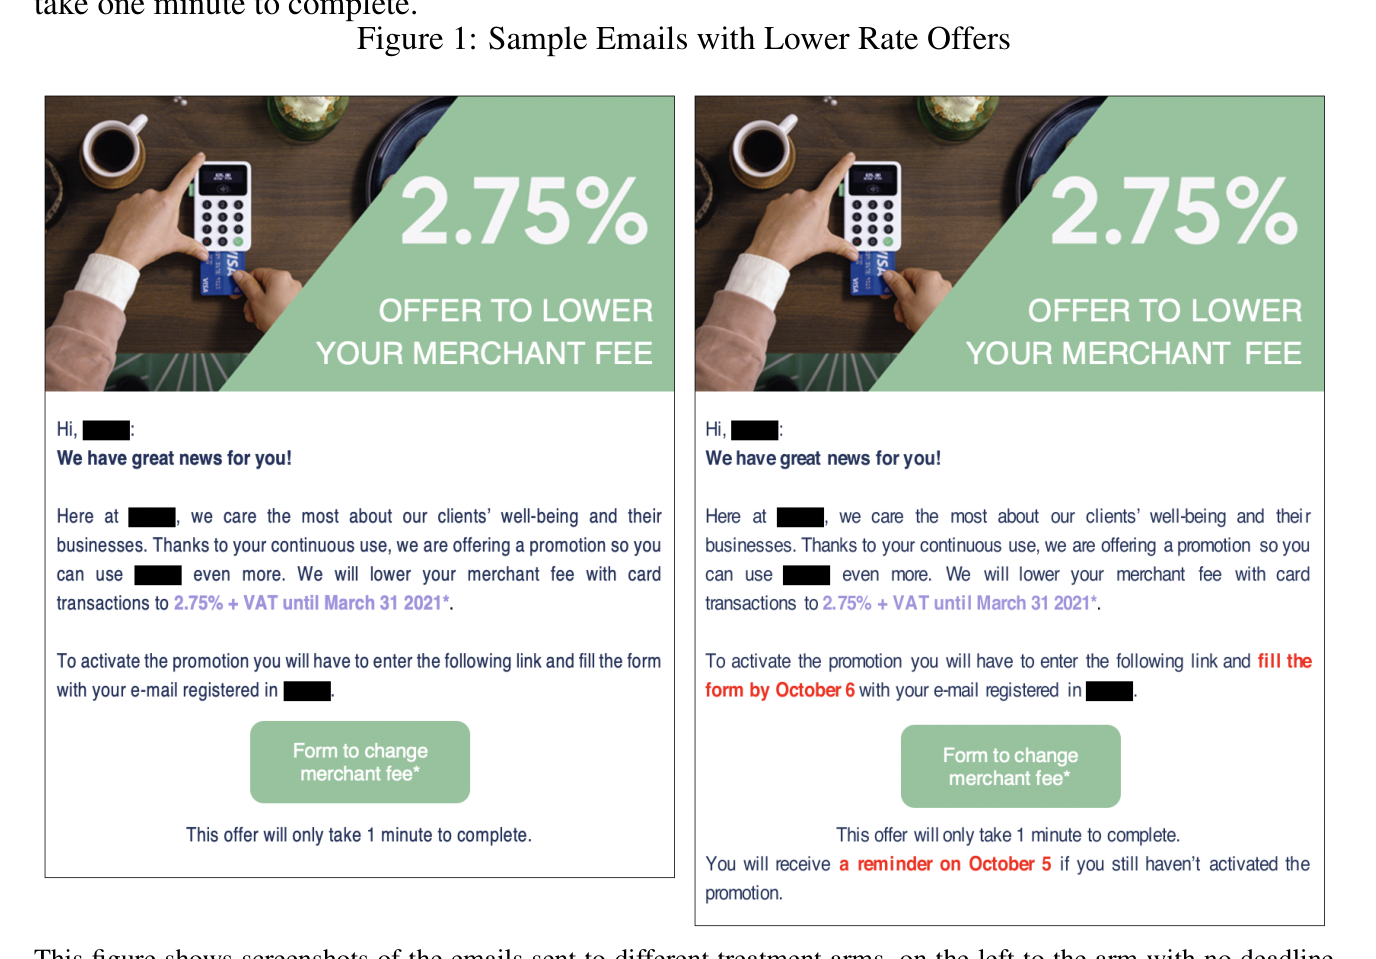
images/gertler_clip_email.png
Fee display. Half of treated merchants get the "fees-this-month" line surfaced prominently on the Chiffres summary; the other half don't. This is the operationalization of Colin's hypothesis that small merchants over-estimate fees. The fee-display sub-arm sits orthogonally inside the 2×2 cells (so we can identify the fee-transparency effect within both content conditions).
Gambling-opt-out (Wave-flagged welfare guardrail). Because consumer-side users have explicitly asked support to hide Trends so gambling transactions don't appear, the business-side experiment defaults to showing per-category hide controls in all treated arms and pre-registers the rate of voluntary hiding (by category) as a primary welfare outcome. No moralizing language in any rules-of-thumb copy — fees and revenue framings only, no spending-discipline framings on gambling-like categories.
Manual entry (optional, smaller). A subset of merchants in the category-breakdown arms get a way to log non-Wave revenue (cash, alternative channels) inside Chiffres. Tests whether fuller category information amplifies the dashboard effect, and whether Wave underwriting against a fuller revenue picture is more predictive of repayment than Wave-only data.
Sample size, at the high end
Five arms × ~2,500–3,500 merchants per arm ≈ 12,500–17,500 merchants total. This is in the same order of magnitude as Gertler et al. (2025) Clip Mexico (n=33,978), well above the Dalton (2024) Kenyan SME RCT (n=620), and supports detecting engagement effects of 3–5 pp and forecast-calibration effects of 0.1 SD with adequate power. We can run smaller and accept wider confidence intervals; the order of magnitude is what we'd defend in a pre-analysis plan.
How Trends informs the cash-advance experiment ¶
─── four scenarios · four dimensions of cash-advance design
Today Wave sets cash-advance loan size, deduction rate, fee structure, and approval thresholds (currently for the Gambian merchant base, with SN / CI expansion ahead) without direct knowledge of how merchants forecast their own short-run revenue or how they perceive the fees they pay. Four concrete scenarios show how the Trends evidence — which can be produced in 1–3 months — will tell Wave which dimension of the cash-advance product is worth testing next.
The Trends experiment is the pre-investigation that tells Wave which cash-advance design is worth a real trial. A 1–3 month read on revenue calibration, Chiffres-shifted requests, engagement-driven utilization, and fee misperception is enough to pick the right cash-advance dimension to vary in the follow-on. The cash-advance experiment does not have to wait for a publishable Trends paper — and the publishable Trends paper does not have to wait for the cash-advance results. The two trials can also run on different markets (Trends in SN/CI, cash advance in the Gambia) to keep them clean.
The evidence base ¶
─── five papers anchor what we expect
The full tight lit review is at wave-trends.pages.dev → Bibliography with structured summaries for 31 papers. The five that anchor the pitch:
- Bloom, Codreanu & Fletcher (2025), Rationalizing Firm Forecasts. Five-year, ten-wave panel of 6,594 US firms on a payment processor; only 18% of forecasts within ±10% of actuals; mean +16% over-optimism; dashboard look-up moves bias contemporaneously without persisting. → measurement template.
- Augenblick, Jack, Kaur, Masiye & Swanson (2025), Retrieval Failures and Consumption Smoothing. Zambian farmers; expense board moves non-food forecast 42–62%, savings 15–20%, next-year crop revenue 8.9%. → mechanism for the rules-of-thumb arm.
- Dalton, Pamuk, Ramrattan, van Soest & Uras (2024), Electronic Payment Technology and Business Finance, MS 70(4). Kenyan SMEs on Safaricom's merchant product; +50% mobile-loan access, zero on revenue/profit, reduced volatility for small firms. → closest direct precedent.
- Bar-Gill, Brynjolfsson & Hak (2024), Helping Small Businesses Become More Data-Driven, MS / NBER WP 31089. eBay Seller Hub rollout; +3.6% sales ITT, >1/3 monitoring-mediated. → upper-bound dashboard analog.
- Gertler, Higgins, Malmendier & Ojeda (2025), NBER WP 33387 (R&R Econometrica). 33,978 Mexican Clip merchants; reminders +15%, pre-announced reminders +7.8% more; trust-mechanism concentrated in newer-relationship merchants. → direct precedent for Wave's T1 arm and the pre-announced-push sub-arm.